Click here for full Monthly Property Report
Click here for House Price Index Report
The Real Estate Institute of New Zealand’s (REINZ) March 2023 figures show the continuing impacts of the economic climate with median prices and sales counts easing and properties taking longer to sell.
REINZ Chief Executive Jen Baird, says there is no denying the current economy is influencing market activity.
“While we have seen activity pick up in March, this year’s summer season has been muted. Prices have eased as we can see, and properties are taking longer to sell. Buyers are taking their time, they are negotiating, and some are waiting to see if prices ease further.”
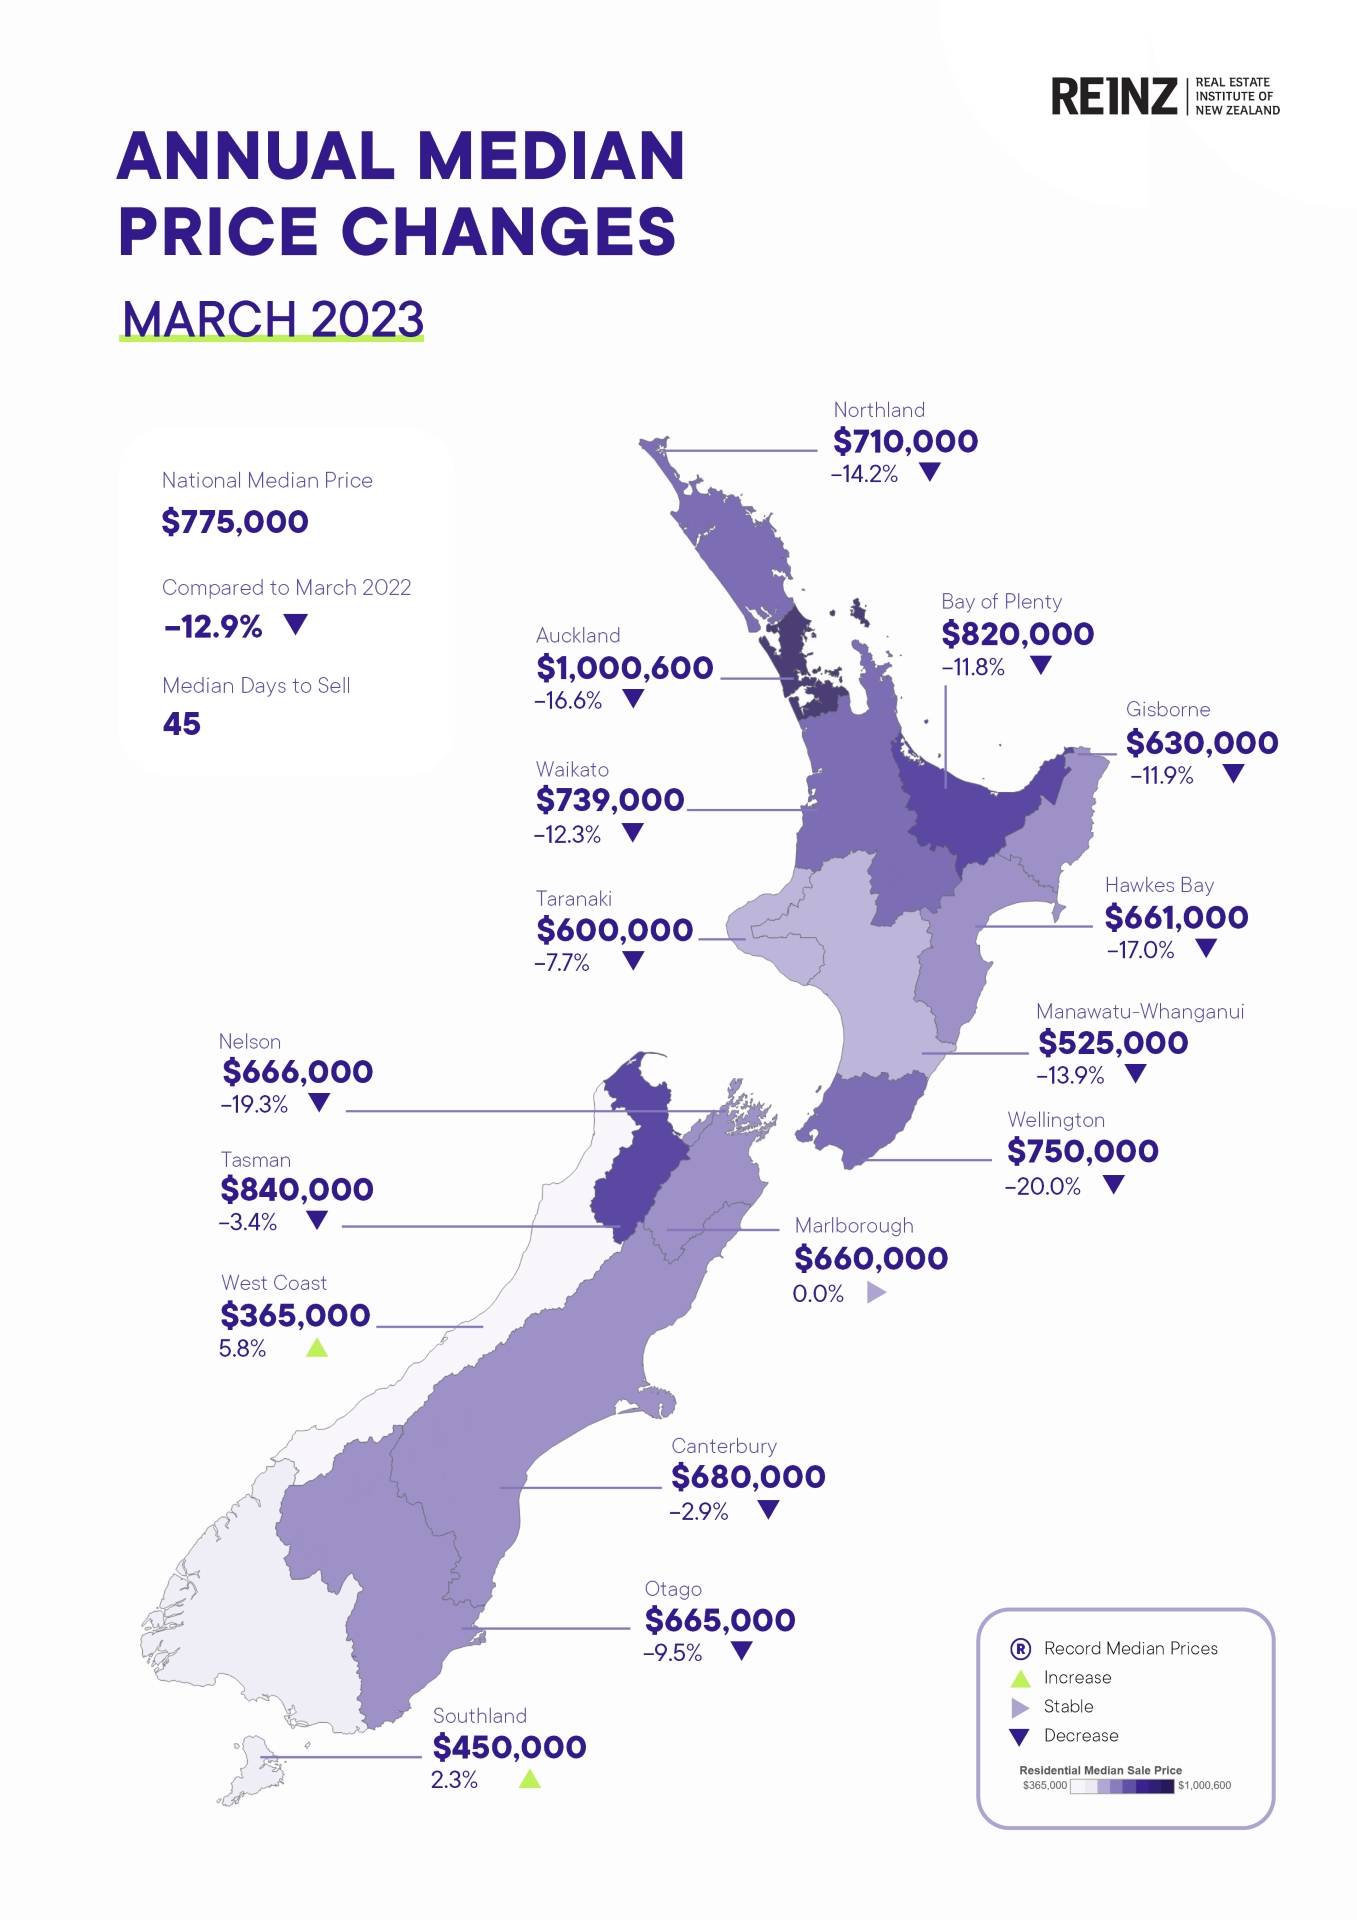
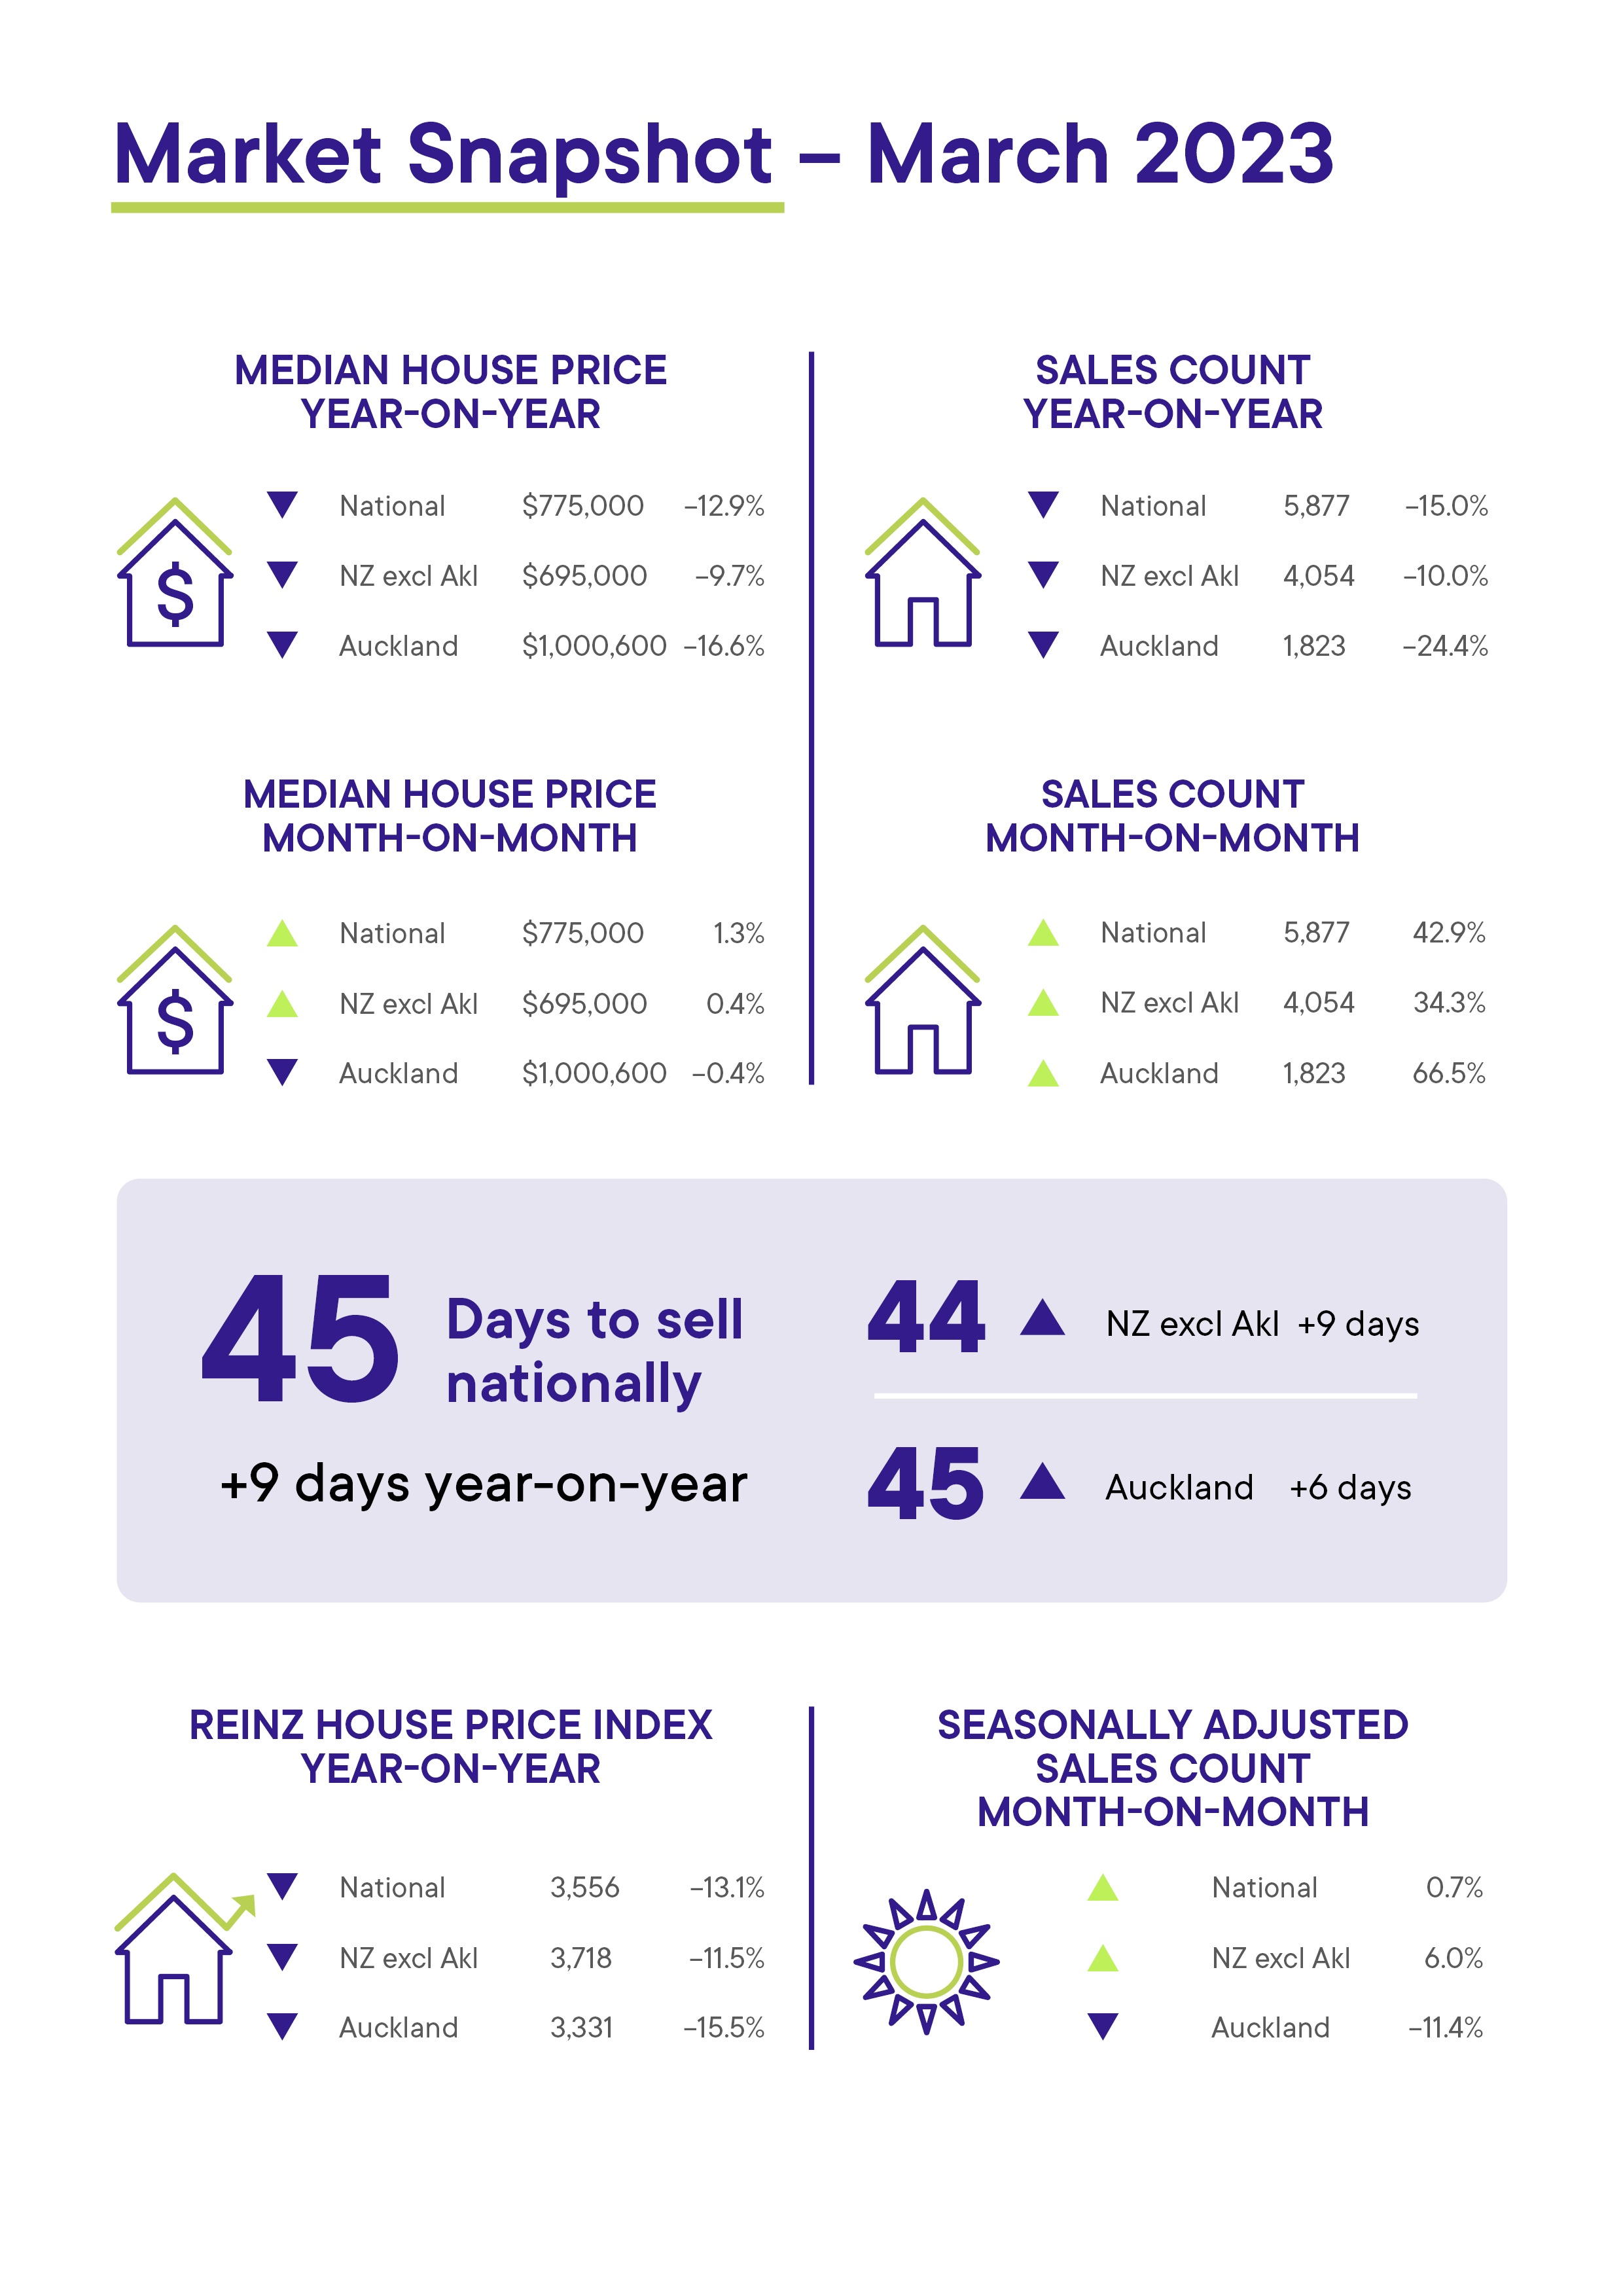
Nationally, the median price decreased 12.9% annually to $775,000 in March 2023. Days to sell have risen to 45 days for March 2023 — up 9 days compared to March 2022 and down 15 days from 60 when compared to February 2023.
At the end of March, the total number of properties for sale across New Zealand was 29,284, up 3,625 properties (+14.1%) year-on-year, and up 0.7% month-on-month. New Zealand excluding Auckland was also up from 14,923 to 18,742, an increase of 3,819 properties annually (+25.6%). Month-on-month, inventory increased 0.5%.
“Inventory levels are returning to the long-term average, which presents an opportunity for buyers looking to take advantage of the lower prices and less competition. REINZ members tell us first home buyers are actively returning in the regions with the advantage of choice as investors remain absent,” says Baird.
The total number of properties sold across New Zealand in March 2023 was 5,877, up from 4,113 in February 2023 (+42.9%), and down 15.0% year-on-year. New Zealand excluding Auckland sales counts decreased by 10.0% year-on-year but increased 34.3% month-on-month.
“There are clear signs that we are in the lower phase of the cycle, but with nearly 6,000 properties sold, vendors who are motivated to sell are meeting the market with more realistic expectations on time frame and price. Those who need to sell are still selling.”
Nationally, new listings decreased by 17.7%, from 11,224 listings in March 2022 to 9,242 listings in March 2023. Compared to February 2023, listings increased by 13.5% from 8,143 to 9,242. New Zealand excluding Auckland listings decreased 15.2% year-on-year from 7,191 to 6,099. Auckland’s listings were down 22.1% from 4,033 to 3,143 year-on-year with the only regions increasing being Taranaki (+9.7%) and Marlborough (+18.6%).
“The weather events of the beginning of year are still being felt in those regions heavily impacted. The market is likely to remain in this phase as New Zealanders wait for peak of inflation, a settling in interest rates and some clarity around the possible outcome of the election. That said, with the number of listings continuing to ease, we may start to see the supply/demand balance change in some areas.”
The REINZ House Price Index (HPI) for New Zealand which measures the changing value of residential property nationwide showed an annual decrease of 13.1% for New Zealand and a 11.5% decrease for New Zealand excluding Auckland.
The Real Estate Institute of New Zealand (REINZ) has the latest and most accurate real estate data in New Zealand.
For more information and data on national and regional activity visit the REINZ’s website.
Media contact:
Laura Wilmot
Head of Communications and Engagement, REINZ
Mobile: 021 953 308
[email protected]
Fact sheet
National highlights
- The impact of Cyclone Gabrielle’s aftermath continues to slow activity in some affected areas.
- Median prices eased across the country by 12.9% year-on-year to $775,000. For New Zealand excluding Auckland, median prices were down 9.7% to $695,000.
- Sales counts eased across the country by 15.0% annually. The number of residential property sales across New Zealand increased month-on-month by 42.9%
- Nationally, new listings decreased by 17.7%, from 11,224 listings in March 2022 to 9,242 listings in March 2023.
- The median number of days to sell a property in March 2023 was 45— 9 days longer than in March 2022.
- The REINZ House Price Index (HPI) for New Zealand showed an annual decrease of 13.1% in the value of residential property nationwide.
- At the end of March 2023, 29,284 properties were available for sale across New Zealand — an annual increase in inventory of 14.1% for New Zealand. For New Zealand excluding Auckland, there was an annual increase of 25.6% (from 14,923 to 18,742 properties).
Regional highlights
- Whilst prices continue to ease annually in most regions, West Coast and Southland saw increases in median sale price to $365,000 and $450,000 respectively.
- Auckland had a 16.6% decrease in the median sale price for March year on year but remains just over $1m price point at $1,000,600.
- Marlborough and Taranaki were the only regions that had an increase in new listings for March year on year at 18.6% and 9.7% respectively.
- Marlborough had a 16 day increase in days to sell and was the only region to see an increase month on month and the largest year on year increase of 49 days.
More information on activity by region can be found in the regional commentaries visit the REINZ website.
Median Prices
Our two biggest cities have seen ongoing year-on-year median price declines for the beginning of 2023.
There were no record median prices at the regional or territorial authority level this month.
Sales Count
New Zealand, New Zealand excluding Auckland, Bay of Plenty, Canterbury, Manawatu-Whanganui, Marlborough, Nelson, Otago and Waikato all had the most sales this month since March 2022.
March saw the lowest sales count in:
- Taranaki since records began
- Auckland, Nelson, Tasman and Wellington since 2008
- NZ, NZ Excl. Auckland, Bay of Plenty, Marlborough, and Waikato since 2011
- Northland since 2012
- Southland since 2013
- Canterbury and Manawatu-Whanganui since 2014
- Otago and West Coast since 2020
Days to Sell
Month-on-month
All regions had a decrease in median days to sell compared to February 2023, bar Gisborne (+1 day) and Marlborough (+16 days)
March 2023* saw the highest median days to sell in Marlborough since June 2012. Nelson and Waikato recorded their lowest median days to sell since May 2022 and June 2022 respectively.
All regions had an increase in median days to sell year-on-year for March except the West Coast – down 8 days annually. At 26 days, this is the lowest median days to sell in the West Coast in a March month since 2004.
In terms of the month of March, March 2023 had the highest median Days to Sell in:
- Hawke’s Bay and Wellington since records began
- Auckland and Marlborough since 2001
- Gisborne since 2002
- New Zealand since 2009
- New Zealand excluding Auckland, Otago and Tasman since 2011
*Excluding the month of January and the two lockdown-affected months of April 2020 and May 2020
House Price Index (HPI)
The HPI measures the changing value of residential property nationwide.
Wellington has been in the bottom two ranked regions seventeen months in a row for the year-on-year HPI movement.
Bay of Plenty and Waikato had their second largest year-on-year drop in HPI since records began.
New Zealand excluding Auckland had its third-largest year-on-year drop in HPI since records began.
Southland is the top-ranked region for HPI year-on-year movement this month. Taranaki ranked second and Otago ranked third.
Inventory
Five of fifteen regions (or 33.0% of all regions) had at least a 45.0% year-on-year increase in inventory.
Three regions (Auckland, Gisborne and Wellington) had less inventory than they had one year ago.
Listings
All but two regions had had a decrease in listings since March 2022.
40% of the regions have had listings decrease by more than 15% year-on-year.
Marlborough and Taranaki were the two regions that had an increase in listings year-on-year. Marlborough increased 18.6% and Taranaki 9.7%.
Inventory and listing data come from realestate.co.nz.
Auctions
Nationally, 11.7% (688) of properties were sold at auction in March 2023, compared to 19.5% (1,352) in March 2022.
New Zealand excluding Auckland saw 7.3% of properties (296) sell by auction compared to 14.5%
(651) the year prior.
More information on activity by region can be found in the regional commentaries visit the REINZ’s website.