Click here for full Monthly Property Report
Click here for House Price Index (HPI) Report
Confidence and positivity are on the rise across almost all regions, according to the latest data from the Real Estate Institute of New Zealand (REINZ). Median prices continue to climb, with only three regions recording annual declines year-on-year, reflecting a market where prices remain resilient even as buyers move at a measured pace. Local salespeople report pockets of strong enquiry, highlighting growing sentiment at a regional level.
With activity varying across September, October, and November, we’ve taken a broader view and applied seasonal adjustments to give a clearer picture of where the market is heading. On this basis, the three months ending November 2025 show the market holding slightly ahead of where it was at the same time last year, with national sales count up (+2.4%) and median price fractionally higher (+0.2%). For New Zealand, excluding Auckland, the picture is a little stronger, with sales count (+4.1%) and median price (+1.5%) both ahead of last year.
“Comparing November 2025 to November 2024 still matters, but looking at the three-month trend helps smooth out monthly ups and downs,” says REINZ Chief Executive Lizzy Ryley. “Taken together, the seasonally adjusted figures suggest the market is continuing to edge in the right direction. While the improvement is gradual, the underlying trend remains more positive than it was a year ago.”
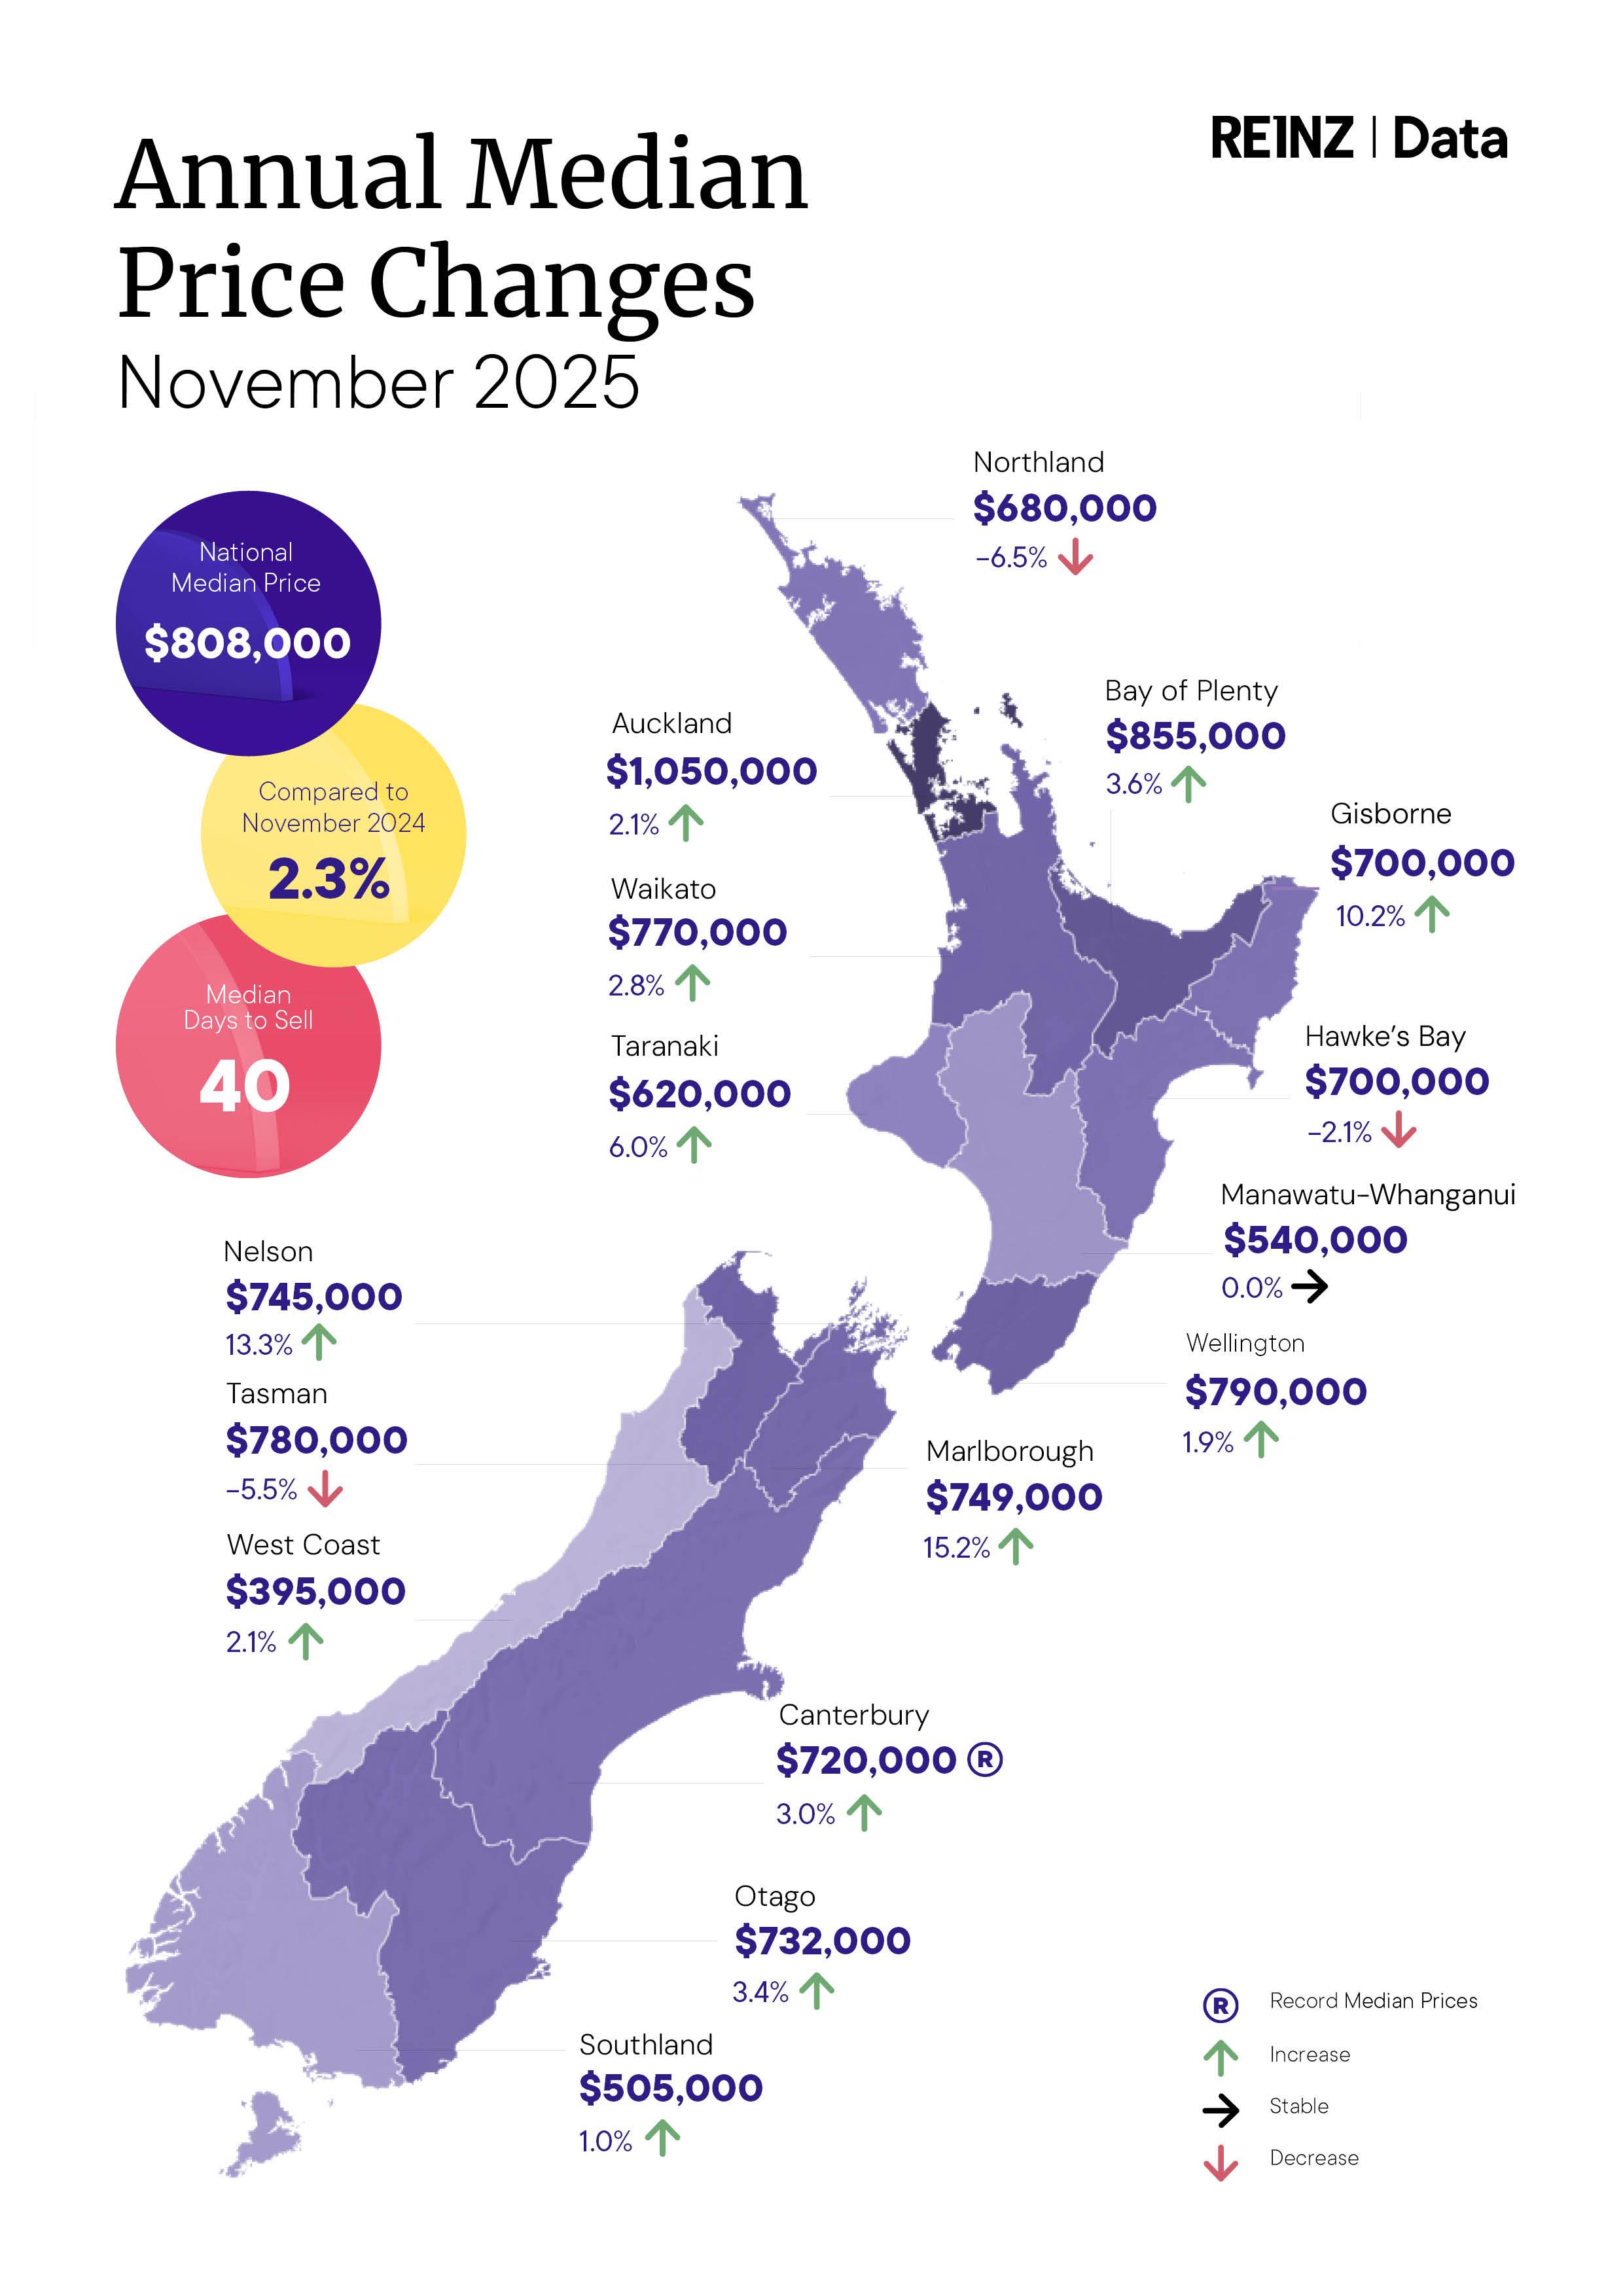
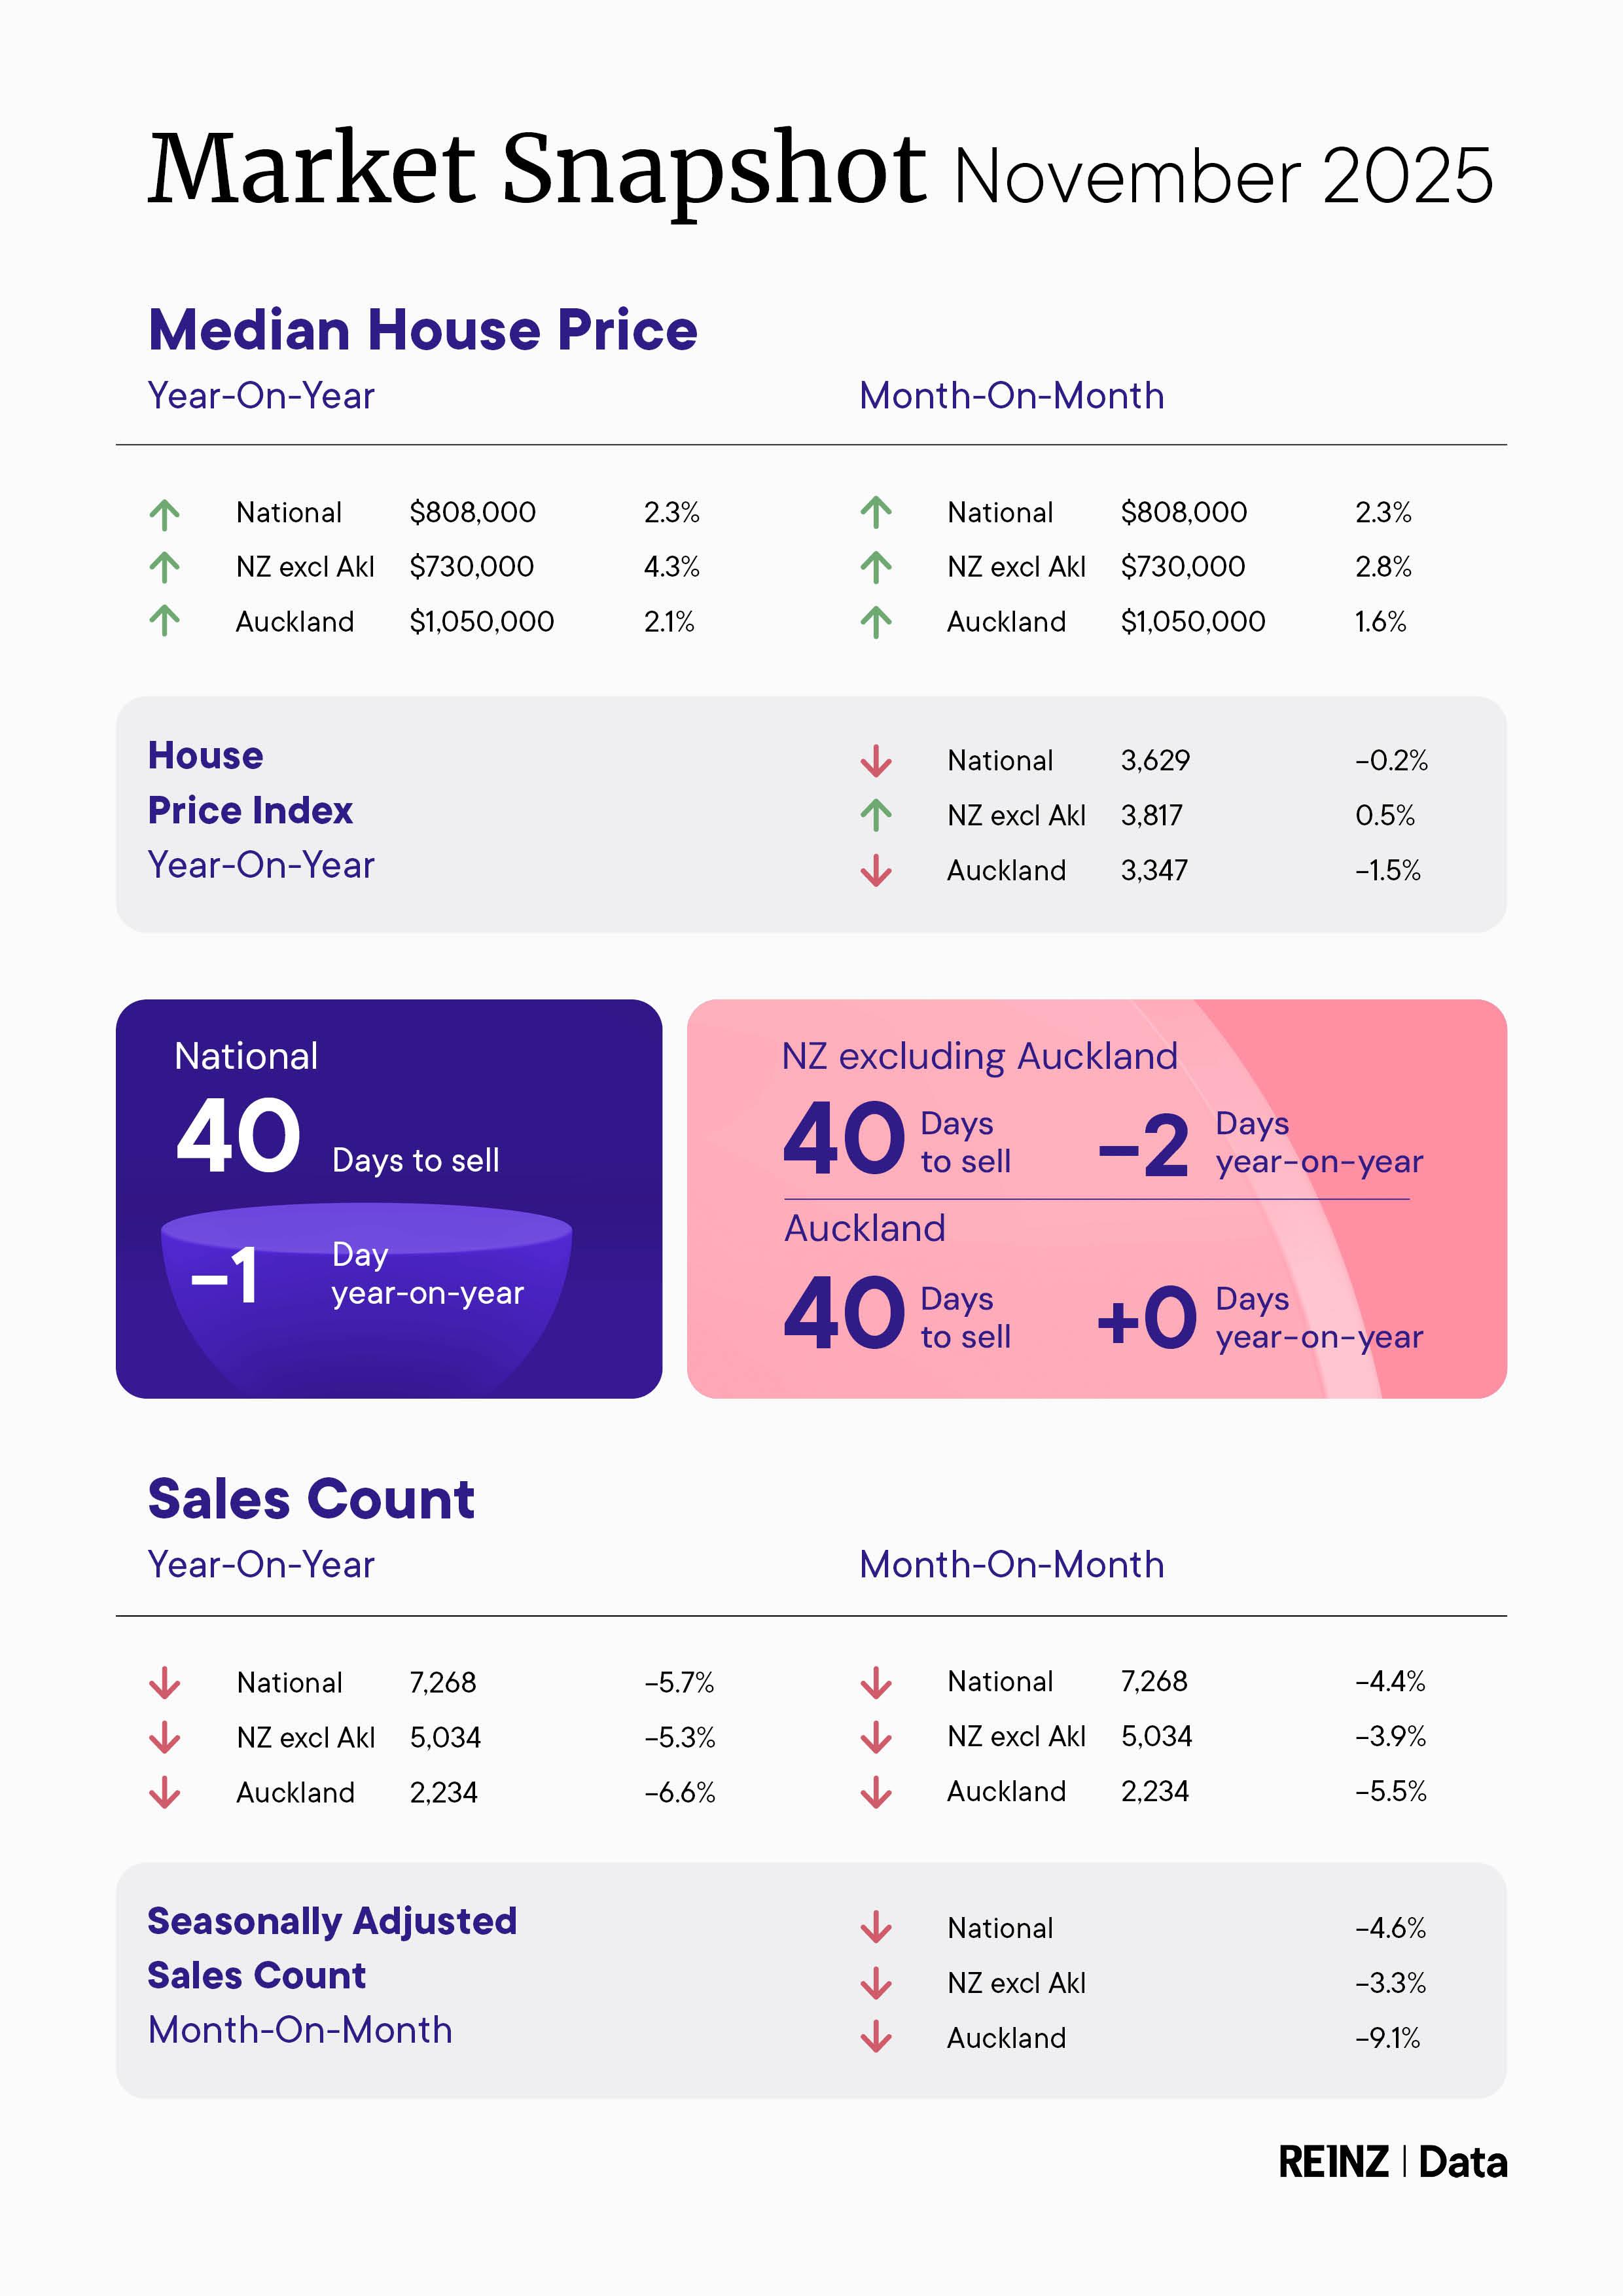
Looking back to November 2025 compared to November 2024, New Zealand’s median price increased by 2.3% year-on-year, to $808,000. Excluding Auckland, the median price increased by 4.3% year-on-year to $730,000.
Twelve out of the sixteen regions reported an increase in median prices year-on-year. Canterbury hit a record median price, up 3.0% year-on-year to $720,000. There were two Territorial Authority (TA) records in Hawke’s Bay’s Wairoa District at $725,000, up 16.7% and in Canterbury’s Waimate District at $549,000, up 6.6%.
“Median sales prices continued to rise across many regions in November, with the national median reaching $808,000 this month. Auckland’s median price is above $1 million ($1,050,000) for the second month in a row, and Canterbury recorded a new high, with the median price hitting $720,000. The broader trend indicates that, despite some local variations, the property market remains resilient, with activity nationwide helping to support price growth,” says Ryley.
The national median Days to Sell decreased by one day to 40 days. For New Zealand, excluding Auckland, it decreased by two days to 40 days. The largest annual reduction in median Days to Sell was observed in Otago, down 12 days from 45 to 33. The greatest year-on-year increase in median Days to Sell was on the West Coast, rising 16 days from 31 to 47 days.
National sales declined 5.7% year-on-year to 7,268, and sales across New Zealand, excluding Auckland, fell 5.3% to 5,034. National month-on-month data also shows declines in sales counts. Only three regions recorded year-on-year increases in sales: Northland, increased by 12.0% to 234 sales; Waikato increased by 2.9% to 768 sales; and Nelson, up 25.8% to 78 sales.
Seasonally adjusted sales figures show that nationally, sales are down slightly month-on-month (-4.6%), compared to the raw data decline of 4.4%. Auckland fell 9.1% month-on-month, while NZ excluding Auckland was slightly softer (-3.3%). In contrast, Northland (+21.6%) and Hawke’s Bay (+5.0%) saw strong month-on-month gains, and regions such as Nelson (-15.7%) and Canterbury (-7.2%) indicate mixed conditions across the country.
“This November marked only the sixth time in 33 years that New Zealand’s November sales count was below October’s, underscoring how unusual it is for activity to ease at this point in the seasonal cycle. Despite the slower sales pace, median prices have remained largely resilient, supported by a stable underlying demand,” continued Ryley.
New listings continue to rise around the country, up 10.9% year-on-year to 12,339. New Zealand, excluding Auckland, also recorded an increase, up 10.2% year-on-year to 8,199. National inventory levels are up 4.0% compared to November 2024, to 35,345.
"First home buyers and owner-occupiers continue to dominate the market," says Ryley. “With plenty of choice available, some buyers remain cautious and are taking time before deciding to purchase. However, salespeople around the country have reported a growing sense of optimism in the market. They’ve also observed that while sales have decreased slightly, some buyers – and some vendors who are selling and buying in the same market – are finding it easier to manage, due to easing interest rates, the November OCR cut, and more flexible lending criteria. These all seem to be contributing to a cautiously optimistic view heading into 2026”
November’s auction sales totalled 1,337 nationally, accounting for 18.4% of all sales. In New Zealand, excluding Auckland, there were 663 auction sales, accounting for 13.2% of all sales. Auction sales in Auckland have increased both year-on-year and month-on-month, with 674 sales, representing 30.2% of all sales.
The House Price Index (HPI) for New Zealand is at 3,629, a 0.2% decrease over the past year and a 0.1% increase month-on-month. However, the index level remains 15.1% below its peak. Over the past five years, New Zealand's average annual HPI compound growth rate has been 1.5%.
ENDS
Media contact:
Communications and Engagement Team
[email protected]
Fact sheet
National Highlights for November
- The total number of properties sold in New Zealand decreased by 5.7% year-on-year, from 7,705 to 7,268 sales. New Zealand, excluding Auckland, saw a decline of 5.3% year-on-year, from 5,314 to 5,034.
- Nationally, the seasonally adjusted figures for New Zealand show a sales count decrease of 4.6% compared to last month. Seasonally adjusted sales figures for New Zealand, excluding Auckland, show a 3.3% month-on-month decrease.
- Listings nationwide increased by 10.9% year-on-year, reaching 12,339 new listings in November. New Zealand, excluding Auckland, saw a 10.2% year-on-year rise, reaching 8,199 new listings.
- The median Days to Sell for New Zealand declined by one day year-on-year, reaching a median of 40 days. The median Days to Sell for New Zealand, excluding Auckland, decreased by two days, reaching the same median Days to Sell, at 40 days.
Regional Highlights for November
- Nelson had the highest sales count increase, up 25.8% year-on-year to 78 sales. The most significant decrease was observed in Gisborne, with a 24.6% year-on-year decline to 43 sales.
- Canterbury recorded a record high median price in November 2025, up 3.0% to $720,000. The largest increase was observed in Marlborough, up 15.2% year-on-year to $749,000
- Twelve regions reported an increase in listings compared to last year. The top three percentage increases were:
o Northland, up 36.1% to 520 listings
o Taranaki, up 33.1% to 338 listings
o Nelson, up 32.9% to 299 listings
More information on activity by region can be found in the regional commentaries on the REINZ's Website.
Median Prices
- Twelve of the sixteen regions recorded a year-on-year rise in the median price, with Marlborough showing the strongest growth at 15.2%.
- Across Auckland’s seven territorial authorities, three recorded an increase compared with November 2024, with North Shore City showing the largest lift at 8.4%.
- In Wellington, five of the eight territorial authorities saw an annual increase, led by Masterton District at 13.6%.
- Canterbury reached a new all-time regional median price record this month; $720,000, which beat the previous high of $717,830 recorded in February 2022.
- A new territorial-authority record was set in Wairoa and Waimate Districts, recording $725,000 (highest since January 2021) and $549,000 (highest since August 2022) respectively
Sales Counts
- For all months
- Wellington had its highest sales count since March 2025
- For the month of November
- Northland and West Coast recorded their highest November sales count since 2020
Median Days to Sell
- For all months
- Otago and Southland had their lowest Days to Sell since December 2021
- Northland had its lowest Days to Sell since December 2022
- Waikato had its lowest Days to Sell since December 2023
- NZ and NZ Excluding Auckland had their lowest Days to Sell since March 2024
- For the month of October
- Gisborne had its highest Days to Sell since 2001, at 55 days.
- Wellington had its highest Days to Sell since 2008 (46 days). It is the equal record highest November Days to Sell for Wellington, with 46 days also recorded in November 1992 and November 2008.
- Marlborough had its highest Days to Sell since 2014, at 51 days.
House Price Index (HPI)
- Southland recorded the strongest HPI movement year on year, increasing 4.7%, ahead of Canterbury (2.5%) and Otago (1.7%). Southland has held the top annual ranking for the past four months, and in 17 of the past 20 months.
- Over the three months to November, Waikato showed the highest HPI growth nationwide, followed by Southland and Northland.
- New Zealand HPI YOY change dipped into the negatives (-0.2%) for the first time since April 2025
Inventory
- Inventory increased year-on-year in ten of the fifteen included regions.
- Auckland and Wellington have each experienced 22 consecutive months of year-on-year inventory growth.
- West Coast has recorded 18 consecutive months of inventory increases, with the most recent twelve months all exceeding 8% year-on-year.
- Manawatu-Whanganui has recorded eight consecutive months of annual declines.
Listings
- New listings increased year on year in twelve of the fifteen included regions.
- Northland showed the strongest annual growth in listings, rising 36.1% on the same month last year.
Auctions
- In New Zealand, there were 1,337 auction sales (18.4% of all sales) in November 2025. In November 2024, there were 1,229 auction sales (16.0% of all sales).
More information on activity by region can be found in the regional commentaries visit the REINZ’s website.