Click here for full Monthly Property Report
Click here for House Price Index (HPI) Report
The Real Estate Institute of New Zealand (REINZ), released their February 2024 data today showing a significant increase in listings and an expansion in stock levels, providing options for buyers.
REINZ Chief Executive Jen Baird says with the combination of high listing numbers, elevated stock and shifts in the median sale price we are seeing increased activity.
“There was a substantial rise in listings nationally, indicating heightened activity in the housing market. New Zealand's stock levels saw a year-on-year increase, resulting in a growing inventory of available properties for sale. Coupled with median sale price growth in some regions, agents are seeing more investors and first-home buyers out there at open homes.
“In the regions, there is an increase in property investment and certain sales volume numbers are reflecting that. Although still below the average February sales count of 60 (2015-2022), Gisborne particularly stands out with remarkable increases in this month’s data. This surge in sales activity suggests strong demand from buyers post the devastating effects of Cyclone Hale and Gabrielle this time in early 2023.” The total number of properties sold increased in February (+81.8%) compared to January 2024 for New Zealand from 3,132 to 5,693 and from 4,129 to 5,693 (+37.9%). Gisborne has seen a large increase in the properties sold up 264% year on year and up year on year by +82.1%.
All regions except for the West Coast saw an increase in activity this month. In 14 of 16 regions, the sales count year-on-year has increased by more than 20%. The exceptions were West Coast (-22.0%) and Taranaki (+7.5%). The Marlborough sales count more than doubled compared to February 2023 (from 37 to 77 sales).
New Zealand’s inventory levels have increased by 8.1% from 29,083 to 31,424 properties year on year.
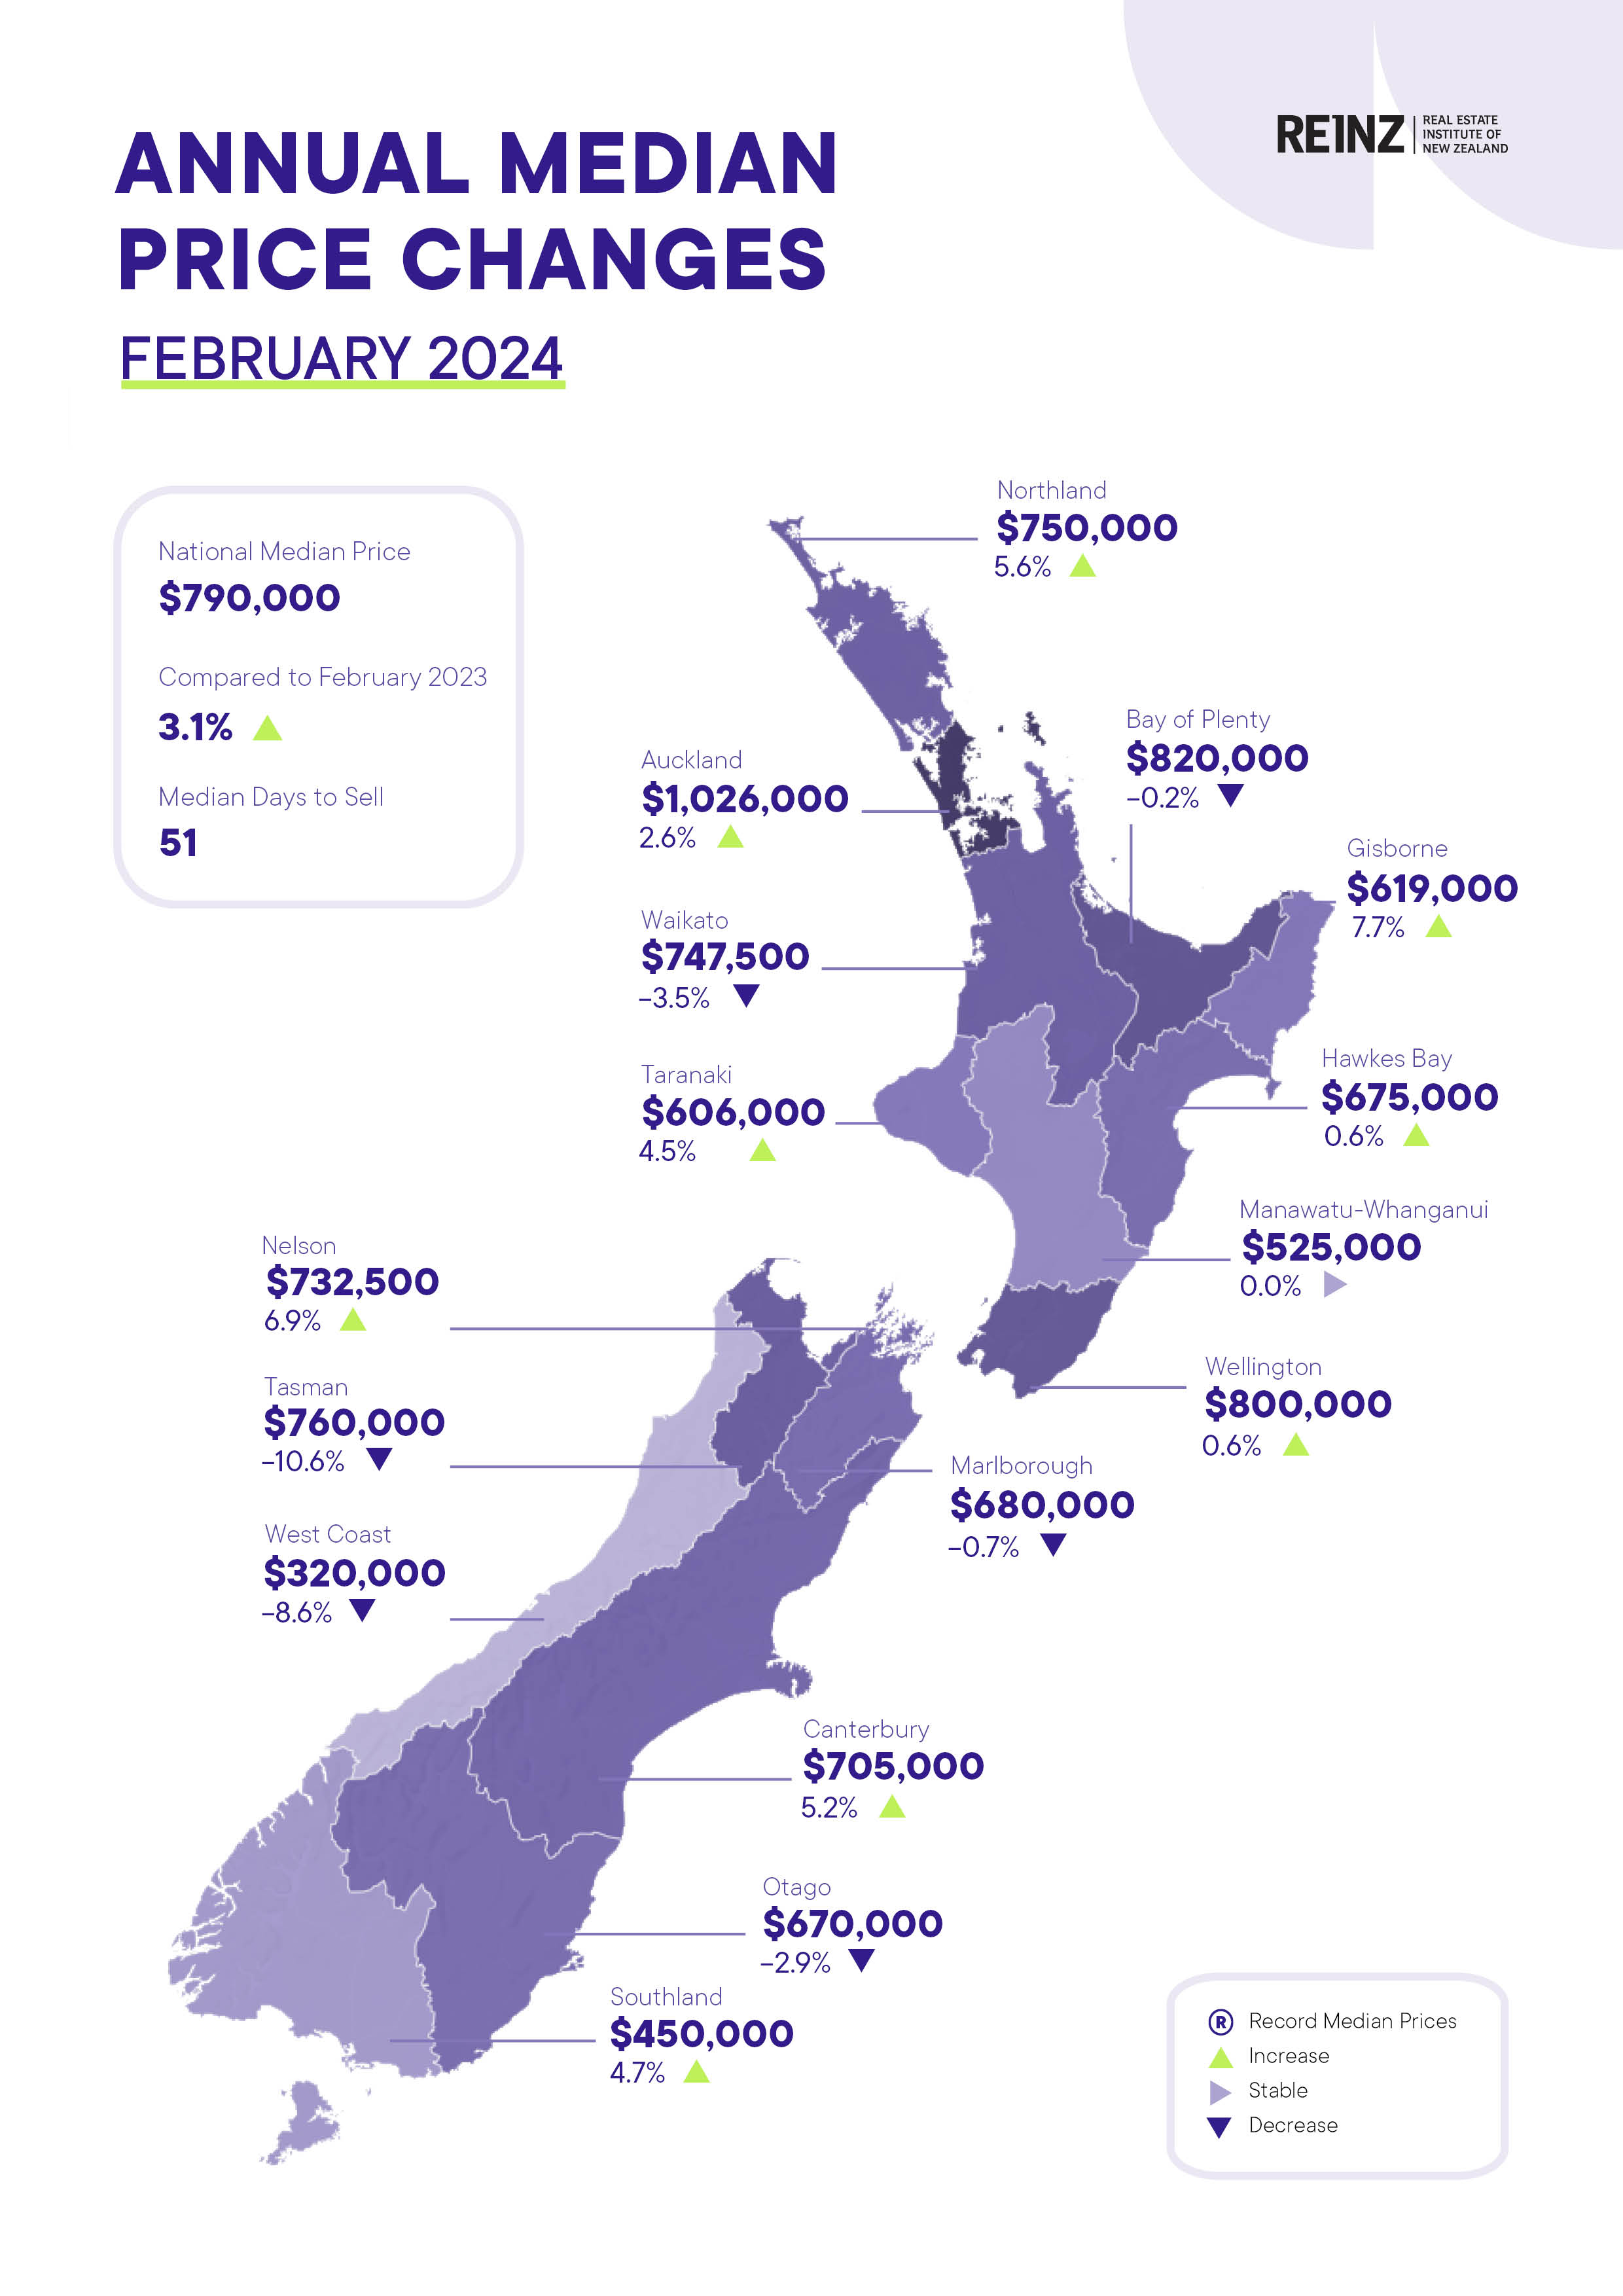
The national median sale price has increased by 3.1% from $766,000 to $790,000 year-on-year. There was also an increase of +3.9% from January 2024 $760,000 to $790,000. New Zealand, excluding Auckland, also increased month-on-month, +3.6% from $685,000 to $710,000 and up year-on-year by 2.6% from $692,000 to $710,000.
Auckland's median sale price has bumped back up over the $1 million mark $1,025,000 in line with the last few years where the month of February also sat over $1 million.
Listings increased by 60.4% from 7,347 to 11,788 nationally month on month and by 44.8% from 8,143 to 11,788 year on year. North Island regions also saw large month-on-month increases with Northland up 247 listings (+94.6%), Wellington up 402 listings (+76.6%), Hawke’s Bay up 141 listings (+75.4%) and Auckland up 1,764 listings (+64.0%).
The median days to sell increased by 1 day month-on-month from 50 up to 51 days and reduced 9 days year-on-year, down from 60 to 51. Northland down 10 days and Wellington down 8 days showed the biggest decreases since February 2023.
Overall, the data paints a picture of a more active housing market in New Zealand, characterised by increasing listings, robust sales activity, expanding stock levels, and growth in property prices.
“We are looking at the back of the government’s 100-day plan and the changes to the bright line test back to two years and the latest reintroduction of interest deductibility on investment properties for landlords. With a significant increase in property listings, the rise in the total number of properties sold, and an increase in the median sale price, some buyers are holding out for the ‘right’ property while others are getting ‘into the market’ before competition rises as investors return. This buoyancy is a positive sign that we haven’t seen for a while,” adds Baird.
For the first time in a long time, there was a new record high set in the regional HPI this month. Otago saw a sizeable monthly increase in HPI pushing over the prior peak set in December 2021. Otago also ranked first in the HPI movements for 1 month (3.0%), 3 months (3.0%) and 12 months (+8.2%).
The HPI for New Zealand, stood at 3,700 in February 2024, a 1.1% increase compared to the previous month and a 3.2% increase for the same period last year. The average annual growth in the New Zealand HPI over the past five years has been 5.9% per annum, and it is currently 13.5% below the peak of the market reached in 2021.
The Real Estate Institute of New Zealand (REINZ) has the latest and most accurate real estate data in New Zealand.
Media contact:
Laura Wilmot
Head of Communications and Engagement, REINZ
Mobile: 021 953 308
[email protected]

Fact sheet
National highlights for February 2024
- The total number of properties sold increased in February (+81.8%) compared to January 2024 for New Zealand from 3,132 to 5,693 and from 4,129 to 5,693 (+37.9%).
- The national median sale price has increased month-on-month by 3.9% from $760,000 to $790,000 and +3.1% year-on-year, $766,000 to $790,000. New Zealand, excluding Auckland, also increased month-on-month, up +3.6% from $685,000 to $710,000 and up year-on-year by 2.6% from $692,000 to $710,000.
- New Zealand’s stock levels have increased 8.1% year-on-year from 29,083 to 31,424 properties and +15.3% month-on-month.
- Listings increased by 60.4% from 8,143 to 11,788 nationally month-on-month and by 44.8% from 7,347 to 11,788 year on year.
- Median Days to Sell increased by 1 day month on month up to 51 days and reduced 9 days year on year down from 60.
- The HPI for New Zealand, stood at 3,700 in February 2024, a 1.1% increase compared to the previous month and a 3.2% increase for the same period last year.
Regional highlights
- Auckland's median sales price increased above the $1 million mark, up to $1,025,000
- North Island regions also saw large month-on-month increases with Northland up 247 listings (+94.6%), Wellington up 402 listings (+76.6%), Hawke’s Bay up 141 listings (+75.4%)
- Otago also ranked first in the HPI movements for 1 month (3.0%), 3 months (3.0%) and 12 months (8.2%).
More information on activity by region can be found in the regional commentaries visit the REINZ website.
Median Prices
- Over half (9 of 16) regions had year-on-year price increases with Gisborne leading the way with a 7.7% increase.
- In Auckland, six of seven Territorial Authorities (TAs) had positive year-on-year median price movements with North Shore City the strongest at +5.3%, followed by Papakura City at +4.1%.
- In Wellington, four of eight TAs had positive year-on-year median price movements with Masterton District leading the way with +18.4%, followed by Upper Hutt City at +11.7%.
- After 20 consecutive months of year-on-year median price decreases, Manawatu-Whanganui has recorded a non-negative year-on-year median price movement (+0.0%).
- New Zealand has recorded its first year-on-year increase since September 2022.
- There were no record median prices at the regional level this month.
- There were two record median prices at the TA level this month; Stratford recorded a 0.2% increase on its prior peak set in March 2022, and Queenstown-Lakes District recorded a 3.0% increase on its prior peak set in May 2022.
Sales counts
- February 2024 saw the lowest sales count in
- Gisborne since December 2021
- Hawke’s Bay since December 2021
- Nelson since March 2023
- Marlborough since May 2023
- In terms of February, February 2024 saw the lowest sales count in:
- In terms of February, February 2024 saw the highest sales count in:
Median Days to Sell
- Nelson had its equal highest median Days to Sell since records began, with January 1996 being the other month Nelson recorded 85 days for this statistic.
- NZ and Taranaki had their highest median Days to Sell since February 2023
- In terms of February, February 2024 had the highest median Days to Sell in:
- Nelson since records began
- Gisborne since 2015
- West Coast since 2020
House Price Index (HPI)
- Otago recorded a record high HPI for the region this month, the first regional record HPI since February 2022.
- All regions except Bay of Plenty had year-on-year HPI increases this month.
- Otago is the top-ranked HPI year-on-year movement this month. Canterbury is second and Southland is third.
- In terms of the 3 months ending HPI movement, Otago ranks first, Southland second and Taranaki third.
Inventory
- Eleven of 15 regions have had an increase in inventory in February 2024 compared to one year prior.
- Northland has had 23 consecutive months where their inventory has been at least 15% higher than the same month the year before.
- Conversely, Gisborne has had 11 consecutive months where their inventory has been at least 20% lower than the same month the year before.
- Wellington recorded its first year-on-year increase in Inventory since January 2023.
Listings
- All 15 regions had a year-on-year increase in listings with Gisborne being the only non-double-digit increase (+9.7%).
- Northland had almost double the number of listings this month than it did in February 2023 (+94.6%)
- Marlborough has had 8 months in a row of year-on-year increases in Listings.
Auctions
- Nationally, 19.4% (1103) of properties were sold at auction in February 2024, compared to 6.0% (188) in January 2024.
Gisborne had the biggest increase in auctions for February 2024 increasing 52.9% compared to January 2024. Auckland (+33.4%), Canterbury(+24.8%) and Bay of Plenty (20.2%) also increased their auction activity compared to January 2024.
More information on activity by region can be found in the regional commentaries visit the REINZ’s website.