Click here for full Monthly Property Report
Click here for House Price Index (HPI) Report
The Real Estate Institute of New Zealand’s (REINZ) April 2023 figures show the continuing challenge of the economic climate has put further pressure on market pace.
REINZ Chief Executive Jen Baird says April tends to be slow due to public and school holidays, and it’s clear those factors combined with a tight economy are still influencing the market.
“Overall, median prices have decreased across New Zealand but are moderating, sales counts have eased annually, and inventory levels have stabilised,” adds Baird.
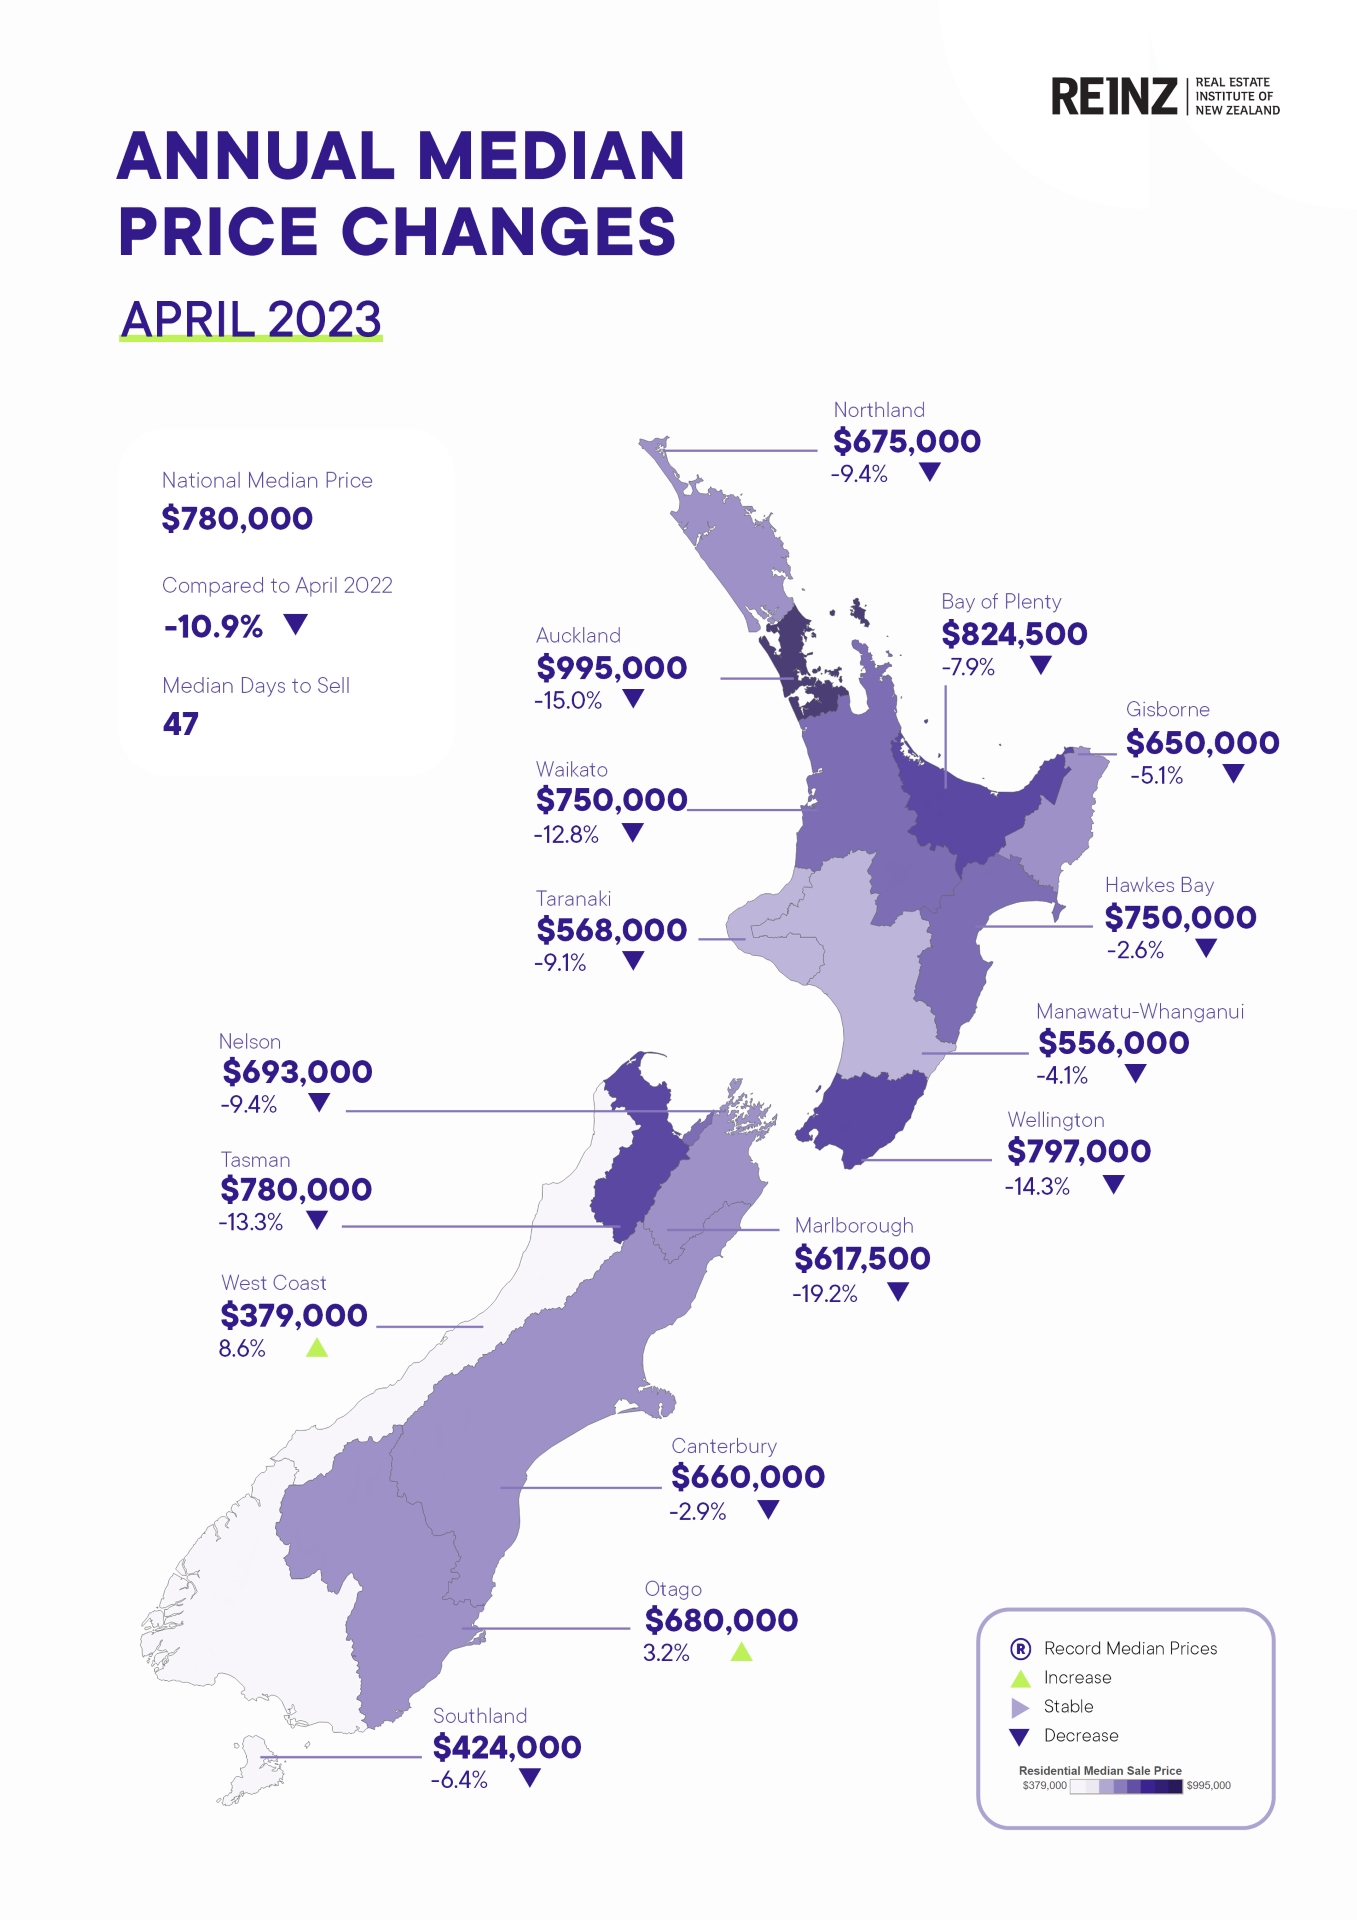
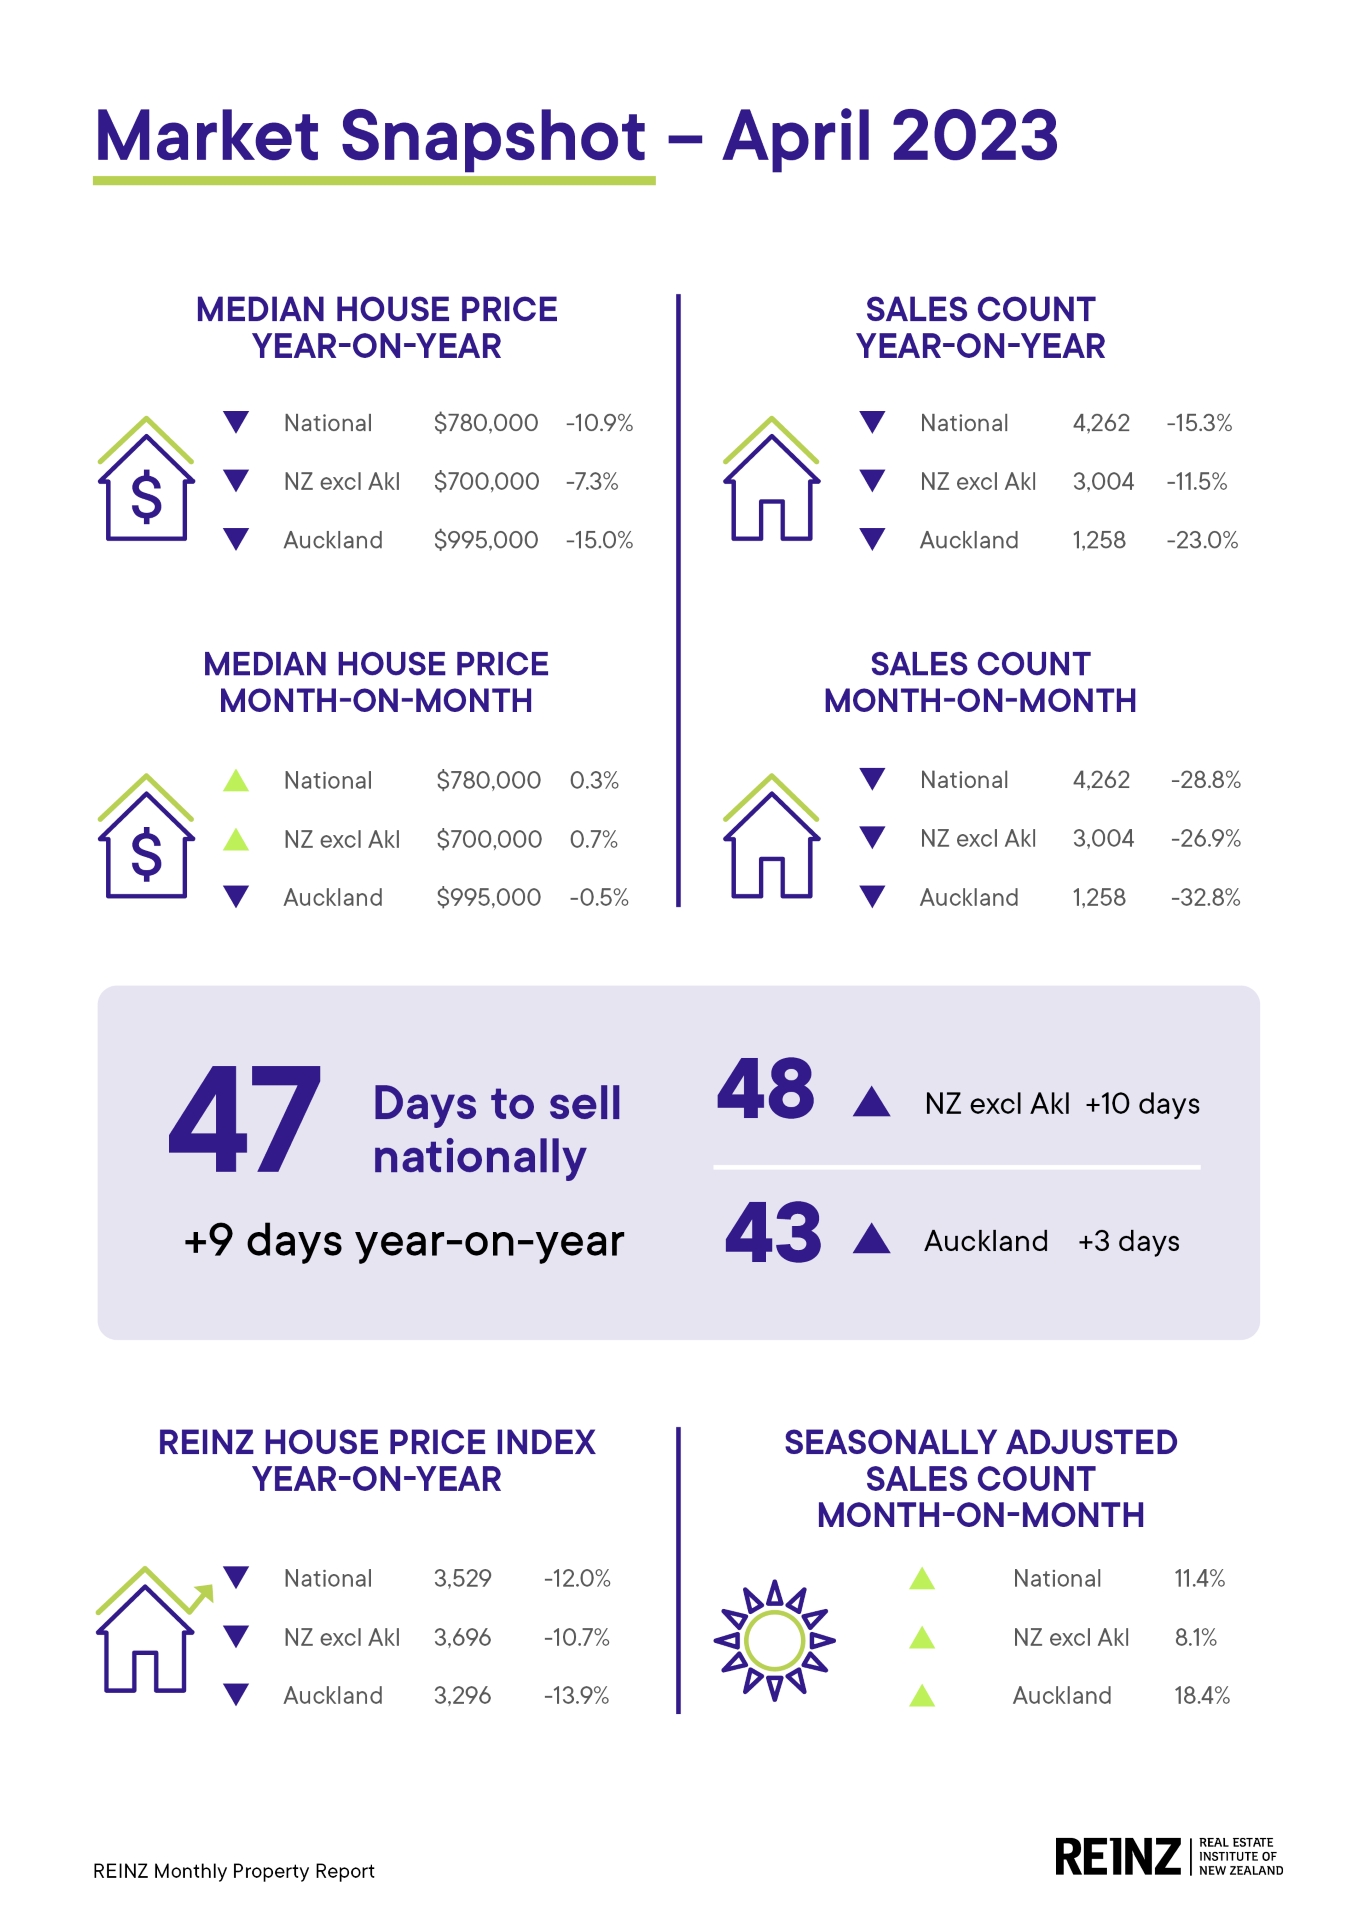
Nationally, the April 2023 median price decreased 10.9 year-on-year to $780,000. Days to sell have risen to 47 days for April 2023 — up 9 days compared to April 2022 and up 2 days from 45 when compared to March 2023. The West Coast and Otago regions saw an annual increase in median price — up 8.6% to $379,000 and 3.2% to $680,000 respectively. Two districts reached record median prices: Grey District ($398,000) and Ashburton District ($615,000).
“Salespeople across the country are reporting glimpses of green shoots in the market this month as first home buyers show more interest after the Reserve Bank’s announced on the easing of LVR restrictions. Our members are seeing further alignment as vendors come with a desire to meet the market – those who are prepared to negotiate and be realistic are the ones selling, there are buyers out there ready to buy. Two districts reached record median prices in April,” states Baird.
At the end of April, the total number of properties for sale across New Zealand was 28,643 up 1,593 properties (+5.9%) year-on-year, and down 2.19% month-on-month. New Zealand excluding Auckland was also up from 17,060 to 18,351 an increase of 1,291 properties annually (+7.6%). Month-on-month, inventory decreased 2.2%.
“Inventory levels have decreased slightly month-on-month, but the year-on-year figures are still showing an increase as the current pressure on mortgage rates supressing buyer activity,” says Baird.
The total number of properties sold across New Zealand in April 2023 was 4,262, down from 5,984 in March 2023 (-28.8%), and down 15.3% year-on-year. New Zealand excluding Auckland sales counts decreased by 11.5% year-on-year and 26.9% month-on-month. While that seems a considerable fall, in seasonally adjusted terms April was 8.1% stronger when compared to the usual seasonal change we would see at the time of year.
Nationally, new listings decreased by 18.9%, from 8,806 listings in April 2022 to 7,142 listings in April 2023. Compared to March 2023, listings decreased by 22.7% from 9,242 to 7,142. New Zealand excluding Auckland listings decreased 20.0% year-on-year from 5,780 to 4,626. Auckland’s listings were down 16.9% from 3,026 to 2,516 year-on-year.
“New Zealanders are waiting for the peak of inflation, a settling in interest rates and some clarity around the outcome of this year’s election. This is what is keeping activity low. However, for those looking to buy, lower prices and good stock levels means there are opportunities as we head into the cooler months.”
“We won’t know if we are at the bottom of the market until we have passed it, so for those who can get their financial ducks in a row, now is a good time to buy,” suggests Baird.
The REINZ House Price Index (HPI) for New Zealand which measures the changing value of residential property nationwide showed an annual decrease of -12.0% for New Zealand and a -10.7% decrease for New Zealand excluding Auckland.
The Real Estate Institute of New Zealand (REINZ) has the latest and most accurate real estate data in New Zealand.
Media contact:
Laura Wilmot
Head of Communications and Engagement, REINZ
Mobile: 021 953 308
[email protected]
Fact sheet
National highlights
- The national median price decreased 10.9% year-on-year to $780,000. For New Zealand excluding Auckland, median prices were down 7.3% to $700,000.
- The total number of properties for sale across New Zealand increased 5.9% year-on-year, and down 2.2% month-on-month.
- The total number of properties sold across New Zealand in April 2023 decreased 15.3% year-on-year, decreased 11.5% month-on-month.
- Nationally, new listings decreased by 18.9%, from 8,806 listings in April 2022 to 7,142 listings in April 2023.
- Days to sell have risen to 47 days for April 2023 — up 9 days compared to April 2022 and up 2 days from 45 when compared to March 2023.
- The REINZ House Price Index (HPI) for New Zealand showed an annual decrease of 0% in the value of residential property nationwide.
Regional highlights
- Whilst prices continue to ease annually in most regions, West Coast and Otago saw increases in median sale price to $379,000 and $680,000 respectively.
- Auckland had a 15.0% decrease in the median sale price for April year-on-year and dropped under the $1m price point to $995,000.
- Six regions had a decrease in the median days to sell.
- West Coast had the highest increase in median days to sell month-on-month (42 days) and the largest year-on-year increase (46 days).
More information on activity by region can be found in the regional commentaries visit the REINZ website.
Median Prices
Our two biggest cities have seen ongoing year-on-year median price declines for the beginning of 2023. Auckland’s median price again dropped under $1,000,000 for the second month running.
There were no record median prices at the regional level.
Grey District and Ashburton District saw record median prices this month.
Sales Count
New Zealand, New Zealand excluding Auckland, Manawatu/Whanganui, Nelson, Taranaki and Wellington all had the lowest sales this month since record began.
April saw the lowest sales count in:
- Southland since 2000
- Bay of Plenty, Otago, and Waikato since 2008
- Canterbury, Northland, and Tasman since 2011
- West Coast since 2017
*Excluding the month of January and the two lockdown-affected months of April 2020 and May 2020
Days to Sell
Month-on-month
All regions had an increase in median days to sell compared to April 2022. West Coast had the highest median days to sell since August 2020.
In terms of the month of April, April 2023 had the highest median days to sell in thirteen of eighteen regions.
House Price Index (HPI)
The HPI measures the changing value of residential property nationwide.
Wellington has been in the bottom two ranked regions eighteen months in a row for the year-on-year HPI movement.
Manawatu-Whanganui and Nelson/Marlborough/Tasman/West Coast regions had their second largest year-on-year drop in HPI since records began.
Bay of Plenty and Waikato had its third-largest year-on-year drop in HPI since records began.
Otago is the top-ranked HPI year-on-year movement this month; Southland is second and Canterbury is third.
Inventory
Four of fifteen regions (27.0%) had at least a 20.0% year-on-year increase in inventory.
Six regions had less inventory than they had one year ago.
Listings
All regions had had a decrease in listings since April 2022.
Eleven of fifteen regions (73%) of the regions have had listings decrease by more than 15% year on year.
Inventory and listing data come from realestate.co.nz.
Auctions
Nationally, 9.6% (395) of properties were sold at auction in April 2023, compared to 14.6% (736) in April 2022.
New Zealand excluding Auckland saw 6.6% of properties (192) sell by auction compared to 10.6%
(359) the year prior.
More information on activity by region can be found in the regional commentaries visit the REINZ’s website.